---
params:
ref: "word-styles-reference-var1.docx"
output_file: CI_report.docx
report_date: "2025-09-30"
data_dir: "aura"
mail_day: "Wednesday"
borders: FALSE
ci_plot_type: "both" # options: "absolute", "cumulative", "both"
colorblind_friendly: TRUE # use colorblind-friendly palettes (viridis/plasma)
facet_by_season: FALSE # facet CI trend plots by season instead of overlaying
x_axis_unit: "days" # x-axis unit for trend plots: "days" or "weeks"
output:
word_document:
reference_docx: !expr file.path("word-styles-reference-var1.docx")
toc: no
editor_options:
chunk_output_type: console
---
```{r setup_parameters, include=FALSE}
# Set up basic report parameters from input values
report_date <- params$report_date
mail_day <- params$mail_day
borders <- params$borders
ci_plot_type <- params$ci_plot_type
colorblind_friendly <- params$colorblind_friendly
facet_by_season <- params$facet_by_season
x_axis_unit <- params$x_axis_unit
```
```{r load_libraries, message=FALSE, warning=FALSE, include=FALSE}
# Configure knitr options
knitr::opts_chunk$set(warning = FALSE, message = FALSE)
# Set flag for reporting scripts to use pivot.geojson instead of pivot_2.geojson
reporting_script <- TRUE
# Load all packages at once with suppressPackageStartupMessages
suppressPackageStartupMessages({
# File path handling
library(here) # For relative path resolution (platform-independent file paths)
# Spatial data handling
library(sf) # For reading/manipulating field boundaries (GeoJSON)
library(terra) # For raster operations (reading mosaic TIFFs for visualization)
# Data manipulation
library(tidyverse) # For dplyr, ggplot2, tidyr (data wrangling and visualization)
library(tidyr) # For data reshaping (pivot_longer, pivot_wider for wide-to-long conversion)
library(lubridate) # For date/time operations (week extraction, date formatting)
library(zoo) # For zoo objects (time series manipulation, na.locf for gap filling)
# Visualization
library(tmap) # For interactive maps (field boundary visualization)
# Reporting
library(knitr) # For R Markdown document generation (code execution and output)
library(flextable) # For formatted tables in Word output (professional table styling)
})
# Load custom utility functions
tryCatch({
source("report_utils.R")
}, error = function(e) {
message(paste("Error loading report_utils.R:", e$message))
# Try alternative path if the first one fails
tryCatch({
source(here::here("r_app", "report_utils.R"))
}, error = function(e) {
stop("Could not load report_utils.R from either location: ", e$message)
})
})
# Function to determine field priority level based on CV and Moran's I
# Returns: 1=Urgent, 2=Monitor, 3=No stress
get_field_priority_level <- function(cv, morans_i) {
# Handle NA values
if (is.na(cv) || is.na(morans_i)) return(3) # Default to no stress
# Determine priority based on thresholds
if (cv < 0.1) {
if (morans_i < 0.7) {
return(3) # No stress
} else if (morans_i <= 0.9) {
return(2) # Monitor (young field with some clustering)
} else {
return(1) # Urgent
}
} else if (cv <= 0.15) {
if (morans_i < 0.7) {
return(2) # Monitor
} else {
return(1) # Urgent
}
} else { # cv > 0.15
return(1) # Urgent
}
}
```
```{r initialize_project_config, message=FALSE, warning=FALSE, include=FALSE}
# Set the project directory from parameters
project_dir <- params$data_dir
# Source project parameters with error handling
tryCatch({
source(here::here("r_app", "parameters_project.R"))
}, error = function(e) {
stop("Error loading parameters_project.R: ", e$message)
})
# Load centralized paths
paths <- setup_project_directories(project_dir)
# Log initial configuration
safe_log("Starting the R Markdown script with KPIs")
safe_log(paste("mail_day params:", params$mail_day))
safe_log(paste("report_date params:", params$report_date))
safe_log(paste("mail_day variable:", mail_day))
```
```{r load_kpi_data, message=FALSE, warning=FALSE}
## SIMPLE KPI LOADING - robust lookup with fallbacks
# First, show working directory for debugging
cat("\n=== DEBUG: R Markdown Working Directory ===\n")
cat(paste("getwd():", getwd(), "\n"))
cat(paste("Expected knit_dir from R Markdown:", knitr::opts_knit$get("root.dir"), "\n\n"))
# Primary expected directory from centralized paths
kpi_data_dir <- paths$kpi_reports_dir
date_suffix <- format(as.Date(report_date), "%Y%m%d")
# Calculate current week from report_date using ISO 8601 week numbering
current_week <- as.numeric(format(as.Date(report_date), "%V"))
current_year <- as.numeric(format(as.Date(report_date), "%G"))
week_suffix <- paste0("week", sprintf("%02d", current_week), "_", current_year)
# Candidate filenames we expect (exact and common variants)
expected_summary_names <- c(
paste0(project_dir, "_kpi_summary_tables_", week_suffix, ".rds"),
paste0(project_dir, "_kpi_summary_tables_", date_suffix, ".rds"),
paste0(project_dir, "_kpi_summary_tables.rds"),
"kpi_summary_tables.rds",
paste0("kpi_summary_tables_", week_suffix, ".rds"),
paste0("kpi_summary_tables_", date_suffix, ".rds")
)
expected_field_details_names <- c(
paste0(project_dir, "_field_details_", week_suffix, ".rds"),
paste0(project_dir, "_field_details_", date_suffix, ".rds"),
paste0(project_dir, "_field_details.rds"),
"field_details.rds"
)
# Helper to attempt loading a file from the directory or fallback to a workspace-wide search
try_load_from_dir <- function(dir, candidates) {
if (!dir.exists(dir)) return(NULL)
for (name in candidates) {
f <- file.path(dir, name)
if (file.exists(f)) return(f)
}
return(NULL)
}
# Try primary directory first
summary_file <- try_load_from_dir(kpi_data_dir, expected_summary_names)
field_details_file <- try_load_from_dir(kpi_data_dir, expected_field_details_names)
# If not found, perform a workspace-wide search (slower) limited to laravel_app storage
if (is.null(summary_file) || is.null(field_details_file)) {
safe_log(paste("KPI files not found in", kpi_data_dir, "—searching workspace for RDS files"))
# List rds files under laravel_app/storage/app recursively
files <- list.files(path = file.path("laravel_app", "storage", "app"), pattern = "\\.rds$", recursive = TRUE, full.names = TRUE)
# Try to match by expected names
if (is.null(summary_file)) {
matched <- files[basename(files) %in% expected_summary_names]
if (length(matched) > 0) summary_file <- matched[1]
}
if (is.null(field_details_file)) {
matched2 <- files[basename(files) %in% expected_field_details_names]
if (length(matched2) > 0) field_details_file <- matched2[1]
}
}
# Final checks and load with safe error messages
kpi_files_exist <- FALSE
# Debug: log what we're looking for
cat("\n=== KPI LOADING DEBUG ===\n")
cat(paste("Working directory:", getwd(), "\n"))
cat(paste("project_dir:", project_dir, "\n"))
cat(paste("report_date:", report_date, "\n"))
cat(paste("Calculated week:", current_week, "year:", current_year, "\n"))
cat(paste("Looking for KPI files in:", kpi_data_dir, "\n"))
cat(paste("Directory exists:", dir.exists(kpi_data_dir), "\n"))
cat(paste("Expected filenames to match:\n"))
for (name in expected_summary_names) cat(paste(" -", name, "\n"))
# List what's actually in the directory
if (dir.exists(kpi_data_dir)) {
actual_files <- list.files(kpi_data_dir, pattern = ".*\\.rds$", full.names = FALSE)
cat(paste("Files in KPI directory (", length(actual_files), " total):\n"))
for (f in actual_files) cat(paste(" -", f, "\n"))
} else {
cat("KPI directory does NOT exist!\n")
}
if (!is.null(summary_file) && file.exists(summary_file)) {
cat(paste("✓ FOUND summary file:", summary_file, "\n"))
cat(paste(" File size:", file.size(summary_file), "bytes\n"))
summary_data <- tryCatch(readRDS(summary_file), error = function(e) { cat(paste("ERROR reading RDS:", e$message, "\n")); NULL })
if (!is.null(summary_data)) {
cat(paste(" ✓ Loaded successfully. Class:", class(summary_data), "\n"))
if (is.list(summary_data)) {
cat(paste(" List names:", paste(names(summary_data), collapse = ", "), "\n"))
}
# Convert new RDS structure (field_analysis, field_analysis_summary) to legacy summary_tables format
if (is.list(summary_data) && !is.data.frame(summary_data)) {
# New format from 09_field_analysis_weekly.R - just pass it through
if ("field_analysis_summary" %in% names(summary_data)) {
cat(" ✓ Found field_analysis_summary in list - will use this structure\n")
# Keep the new structure intact - combined_kpi_table will use it directly
kpi_files_exist <- TRUE
} else {
cat(" ! Old format detected\n")
# Old format - keep as is
summary_tables <- summary_data
if (!is.null(summary_tables)) kpi_files_exist <- TRUE
}
} else {
cat(" ! Data frame format\n")
# Data frame format or direct tables
summary_tables <- summary_data
if (!is.null(summary_tables)) kpi_files_exist <- TRUE
}
} else {
cat(" ✗ Failed to load RDS - summary_data is NULL\n")
}
} else {
safe_log(paste("KPI summary file not found. Searched:", paste(expected_summary_names, collapse=", ")), "WARNING")
safe_log(paste("Attempted directory:", kpi_data_dir), "WARNING")
# Try searching the entire workspace as fallback
files <- list.files(path = file.path("laravel_app", "storage", "app"), pattern = "kpi.*\\.rds$", recursive = TRUE, full.names = TRUE)
safe_log(paste("Found", length(files), "KPI RDS files in workspace"), "INFO")
if (length(files) > 0) {
safe_log(paste("Available files:", paste(basename(files), collapse = ", ")), "INFO")
}
}
if (!is.null(field_details_file) && file.exists(field_details_file)) {
safe_log(paste("Loading field details from:", field_details_file))
field_details_table <- tryCatch(readRDS(field_details_file), error = function(e) { safe_log(paste("Failed to read field details RDS:", e$message), "ERROR"); NULL })
if (!is.null(field_details_table)) kpi_files_exist <- kpi_files_exist && TRUE
} else {
safe_log(paste("Field details file not found. Searched:", paste(expected_field_details_names, collapse=", ")), "WARNING")
# Try to extract field_details from summary_data if available
if (exists("summary_data") && !is.null(summary_data) && "field_analysis" %in% names(summary_data)) {
field_details_table <- summary_data$field_analysis %>%
rename(`Mean CI` = Acreage, `CV Value` = CV, Field = Field_id)
safe_log("Extracted field details from field_analysis data")
}
}
if (kpi_files_exist) {
safe_log("✓ KPI summary tables loaded successfully")
} else {
safe_log("KPI files could not be located or loaded. KPI sections will be skipped.", "WARNING")
}
```
```{r load_cloud_coverage_data, message=FALSE, warning=FALSE, include=FALSE}
## LOAD PER-FIELD CLOUD COVERAGE DATA
# Cloud coverage calculated from the mosaic by script 09
# Expected filename pattern: [project_dir]_cloud_coverage_week[N].rds or _cloud_coverage_[date].rds
expected_cloud_names <- c(
paste0(project_dir, "_cloud_coverage_week", week_suffix, ".rds"),
paste0(project_dir, "_cloud_coverage_week", current_week, ".rds"),
paste0(project_dir, "_cloud_coverage_", date_suffix, ".rds"),
paste0(project_dir, "_cloud_coverage.rds"),
paste0(project_dir, "_per_field_cloud_coverage.rds"),
"cloud_coverage.rds",
"per_field_cloud_coverage.rds"
)
# Try to load cloud coverage from KPI directory
cloud_file <- try_load_from_dir(kpi_data_dir, expected_cloud_names)
# If not found in KPI dir, search workspace
if (is.null(cloud_file)) {
files <- list.files(path = file.path("laravel_app", "storage", "app"), pattern = "\\.rds$", recursive = TRUE, full.names = TRUE)
matched <- files[basename(files) %in% expected_cloud_names]
if (length(matched) > 0) cloud_file <- matched[1]
}
# Load cloud coverage data if file exists
per_field_cloud_coverage <- NULL
cloud_coverage_available <- FALSE
if (!is.null(cloud_file) && file.exists(cloud_file)) {
safe_log(paste("Loading cloud coverage data from:", cloud_file))
per_field_cloud_coverage <- tryCatch(
readRDS(cloud_file),
error = function(e) {
safe_log(paste("Failed to read cloud coverage RDS:", e$message), "WARNING");
NULL
}
)
if (!is.null(per_field_cloud_coverage) && nrow(per_field_cloud_coverage) > 0) {
cloud_coverage_available <- TRUE
safe_log("✓ Per-field cloud coverage data loaded successfully")
}
} else {
safe_log("Per-field cloud coverage file not found. Cloud sections will be skipped.", "WARNING")
}
```
#' Generate field-specific KPI summary for display in reports
#' @param field_name Name of the field to summarize
#' @param field_details_table Data frame with field-level KPI details
#' @return Formatted text string with field KPI summary
generate_field_kpi_summary <- function(field_name, field_details_table, CI_quadrant) {
tryCatch({
# Get field age from CI quadrant data for the CURRENT SEASON only
# First identify the current season for this field
current_season <- CI_quadrant %>%
filter(field == field_name, Date <= as.Date(report_date)) %>%
group_by(season) %>%
summarise(season_end = max(Date), .groups = 'drop') %>%
filter(season == max(season)) %>%
pull(season)
# Get the most recent DOY from the current season
field_age <- CI_quadrant %>%
filter(field == field_name, season == current_season) %>%
pull(DOY) %>%
max(na.rm = TRUE)
# Filter data for this specific field
field_data <- field_details_table %>%
filter(Field == field_name)
if (nrow(field_data) == 0) {
return(paste("**Field", field_name, "KPIs:** Data not available"))
}
# Aggregate sub-field data for field-level summary
# For categorical data, take the most common value or highest risk level
field_summary <- field_data %>%
summarise(
field_size = sum(`Field Size (ha)`, na.rm = TRUE),
uniformity_levels = paste(unique(`Growth Uniformity`), collapse = "/"),
avg_yield_forecast = ifelse(is.na(`Yield Forecast (t/ha)`[1]), NA, mean(`Yield Forecast (t/ha)`, na.rm = TRUE)),
max_gap_score = max(`Gap Score`, na.rm = TRUE),
highest_decline_risk = case_when(
any(`Decline Risk` == "Very-high") ~ "Very-high",
any(`Decline Risk` == "High") ~ "High",
any(`Decline Risk` == "Moderate") ~ "Moderate",
any(`Decline Risk` == "Low") ~ "Low",
TRUE ~ "Unknown"
),
highest_weed_risk = case_when(
any(`Weed Risk` == "High") ~ "High",
any(`Weed Risk` == "Moderate") ~ "Moderate",
any(`Weed Risk` == "Low") ~ "Low",
TRUE ~ "Unknown"
),
avg_mean_ci = mean(`Mean CI`, na.rm = TRUE),
avg_cv = mean(`CV Value`, na.rm = TRUE),
.groups = 'drop'
)
# Apply age-based filtering to yield forecast
if (is.na(field_age) || field_age < 240) {
field_summary$avg_yield_forecast <- NA_real_
}
# Format the summary text
yield_text <- if (is.na(field_summary$avg_yield_forecast)) {
"Yield Forecast: NA"
} else {
paste0("Yield Forecast: ", round(field_summary$avg_yield_forecast, 1), " t/ha")
}
kpi_text <- paste0(
"Size: ", round(field_summary$field_size, 1), " ha • Growth Uniformity: ", field_summary$uniformity_levels,
" • ", yield_text, " • Gap Score: ", round(field_summary$max_gap_score, 1),
" • Decline Risk: ", field_summary$highest_decline_risk, " • Weed Risk: ", field_summary$highest_weed_risk,
" • Mean CI: ", round(field_summary$avg_mean_ci, 2)
)
# Wrap in smaller text HTML tags for Word output
#kpi_text <- paste0("", kpi_text, "")
kpi_text <- paste0("", kpi_text, "")
# Add alerts based on risk levels (smaller font too)
# alerts <- c()
# if (field_summary$highest_decline_risk %in% c("High", "Very-high")) {
# alerts <- c(alerts, "🚨 High risk of growth decline detected")
# }
# if (field_summary$highest_weed_risk == "High") {
# alerts <- c(alerts, "⚠️ High weed presence detected")
# }
# if (field_summary$max_gap_score > 20) {
# alerts <- c(alerts, "💡 Significant gaps detected - monitor closely")
# }
# if (field_summary$avg_cv > 0.25) {
# alerts <- c(alerts, "⚠️ Poor field uniformity - check irrigation/fertility")
# }
# if (length(alerts) > 0) {
# kpi_text <- paste0(kpi_text, "\n\n", paste(alerts, collapse = "\n"))
# }
return(kpi_text)
}, error = function(e) {
safe_log(paste("Error generating KPI summary for field", field_name, ":", e$message), "ERROR")
return(paste("**Field", field_name, "KPIs:** Error generating summary"))
})
}
```
```{r calculate_dates_and_weeks, message=FALSE, warning=FALSE, include=FALSE}
# Set locale for consistent date formatting
Sys.setlocale("LC_TIME", "C")
# Initialize date variables from parameters
today <- as.character(report_date)
mail_day_as_character <- as.character(mail_day)
# Calculate report dates and weeks using ISO 8601 week numbering
report_date_obj <- as.Date(today)
current_week <- as.numeric(format(report_date_obj, "%V"))
year <- as.numeric(format(report_date_obj, "%Y"))
# Calculate dates for weekly analysis
week_start <- report_date_obj - ((as.numeric(format(report_date_obj, "%w")) + 1) %% 7)
week_end <- week_start + 6
# Calculate week days (copied from 05 script for compatibility)
report_date_as_week_day <- weekdays(lubridate::ymd(today))
days_of_week <- c("Sunday", "Monday", "Tuesday", "Wednesday", "Thursday", "Friday", "Saturday")
# Calculate initial week number
week <- lubridate::week(today)
safe_log(paste("Initial week calculation:", week, "today:", today))
# Calculate previous dates for comparisons
today_minus_1 <- as.character(lubridate::ymd(today) - 7)
today_minus_2 <- as.character(lubridate::ymd(today) - 14)
today_minus_3 <- as.character(lubridate::ymd(today) - 21)
# Adjust week calculation based on mail day
if (which(days_of_week == report_date_as_week_day) > which(days_of_week == mail_day_as_character)) {
safe_log("Adjusting weeks because of mail day")
week <- lubridate::week(today) + 1
today_minus_1 <- as.character(lubridate::ymd(today))
today_minus_2 <- as.character(lubridate::ymd(today) - 7)
today_minus_3 <- as.character(lubridate::ymd(today) - 14)
}
# Calculate week numbers for previous weeks
week_minus_1 <- week - 1
week_minus_2 <- week - 2
week_minus_3 <- week - 3
# Format current week with leading zeros
week <- sprintf("%02d", week)
safe_log(paste("Report week:", current_week, "Year:", year))
safe_log(paste("Week range:", week_start, "to", week_end))
```
```{r load_ci_data, message=FALSE, warning=FALSE, include=FALSE}
# Load CI index data with error handling
tryCatch({
CI_quadrant <- readRDS(here::here(cumulative_CI_vals_dir, "All_pivots_Cumulative_CI_quadrant_year_v2.rds"))
safe_log("Successfully loaded CI quadrant data")
}, error = function(e) {
stop("Error loading CI quadrant data: ", e$message)
})
```
```{r compute_benchmarks_once, include=FALSE}
# Compute CI benchmarks once for the entire estate
benchmarks <- compute_ci_benchmarks(CI_quadrant, project_dir, c(10, 50, 90))
if (!is.null(benchmarks)) {
safe_log("Benchmarks computed successfully for the report")
} else {
safe_log("Failed to compute benchmarks", "WARNING")
}
```
## Report Summary
**Farm Location:** `r toupper(project_dir)` Estate
**Report Period:** Week `r current_week` of `r year`
**Data Source:** Planet Labs Satellite Imagery
**Analysis Type:** Chlorophyll Index (CI) Monitoring
**Report Generated on:** `r format(Sys.time(), "%B %d, %Y at %H:%M")`
## Report Structure
**Section 1:** Farm-wide analyses, summaries and Key Performance Indicators (KPIs)
**Section 3:** Explanation of the report, definitions, methodology, and CSV export structure
**Bonus:** Weekly field-level CSV export with per-field analysis and summary statistics (generated alongside this report)
## Key Insights
```{r key_insights, echo=FALSE, results='asis'}
# Calculate key insights from KPI data
if (exists("summary_data") && !is.null(summary_data) && "field_analysis" %in% names(summary_data)) {
field_analysis_df <- summary_data$field_analysis
field_analysis_summary <- summary_data$field_analysis_summary
# Field uniformity insights
field_cv <- field_analysis_df$CV
excellent_fields <- sum(field_cv < 0.08, na.rm = TRUE)
good_fields <- sum(field_cv >= 0.08 & field_cv < 0.15, na.rm = TRUE)
total_fields <- sum(!is.na(field_cv))
excellent_pct <- ifelse(total_fields > 0, round(excellent_fields / total_fields * 100, 1), 0)
good_pct <- ifelse(total_fields > 0, round(good_fields / total_fields * 100, 1), 0)
# Area change insights - extract from field_analysis_summary
parse_ci_change <- function(change_str) {
if (is.na(change_str)) return(NA)
match <- regexpr("^[+-]?[0-9]+\\.?[0-9]*", change_str)
if (match > 0) {
return(as.numeric(substr(change_str, match, attr(match, "match.length"))))
}
return(NA)
}
field_analysis_df$ci_change_numeric <- sapply(field_analysis_df$Weekly_ci_change, parse_ci_change)
total_acreage <- sum(field_analysis_df$Acreage, na.rm = TRUE)
improving_acreage <- sum(field_analysis_df$Acreage[field_analysis_df$ci_change_numeric > 0.2], na.rm = TRUE)
declining_acreage <- sum(field_analysis_df$Acreage[field_analysis_df$ci_change_numeric < -0.2], na.rm = TRUE)
improving_pct <- ifelse(total_acreage > 0, round(improving_acreage / total_acreage * 100, 1), 0)
declining_pct <- ifelse(total_acreage > 0, round(declining_acreage / total_acreage * 100, 1), 0)
cat("- ", excellent_pct, "% of fields have excellent uniformity (CV < 0.08)\n", sep="")
cat("- ", good_pct, "% of fields have good uniformity (CV < 0.15)\n", sep="")
cat("- ", round(improving_acreage, 1), " acres (", improving_pct, "%) of farm area is improving week-over-week\n", sep="")
cat("- ", round(declining_acreage, 1), " acres (", declining_pct, "%) of farm area is declining week-over-week\n", sep="")
} else {
cat("KPI data not available for key insights.\n")
}
```
\newpage
# Section 1: Farm-wide Analyses and KPIs
## Executive Summary - Key Performance Indicators
```{r combined_kpi_table, echo=TRUE}
# Debug: check what variables exist
cat("\n=== DEBUG: combined_kpi_table chunk ===\n")
cat(paste("exists('summary_data'):", exists("summary_data"), "\n"))
cat(paste("exists('kpi_files_exist'):", exists("kpi_files_exist"), "\n"))
if (exists("kpi_files_exist")) {
cat(paste("kpi_files_exist value:", kpi_files_exist, "\n"))
}
if (exists("summary_data")) {
cat(paste("summary_data class:", class(summary_data), "\n"))
if (is.list(summary_data)) {
cat(paste("summary_data names:", paste(names(summary_data), collapse = ", "), "\n"))
cat(paste("has field_analysis_summary:", "field_analysis_summary" %in% names(summary_data), "\n"))
}
} else {
cat("summary_data DOES NOT EXIST in this chunk's environment!\n")
}
cat("\n")
# Create summary KPI table from field_analysis_summary data
# This shows: Phases, Triggers, Area Change, and Total Farm acreage
if (exists("summary_data") && !is.null(summary_data) && "field_analysis" %in% names(summary_data)) {
# Load field analysis data
field_analysis_df <- summary_data$field_analysis
# If field_analysis_summary is NULL or doesn't exist, create it from field_analysis_df
if (is.null(summary_data$field_analysis_summary) || !("field_analysis_summary" %in% names(summary_data)) ||
!is.data.frame(summary_data$field_analysis_summary)) {
cat("\nNote: field_analysis_summary not in RDS, creating from field_analysis...\n")
# Create summary by aggregating by Status_Alert and Phase categories
# This groups fields by their phase and status to show distribution
phase_summary <- field_analysis_df %>%
filter(!is.na(Phase)) %>%
group_by(Phase) %>%
summarise(Acreage = sum(Acreage, na.rm = TRUE), .groups = "drop") %>%
mutate(Category = Phase) %>%
select(Category, Acreage)
# Try to create Status trigger summary - use Status_Alert if available, otherwise use empty
trigger_summary <- tryCatch({
field_analysis_df %>%
filter(!is.na(Status_Alert), Status_Alert != "") %>%
group_by(Status_Alert) %>%
summarise(Acreage = sum(Acreage, na.rm = TRUE), .groups = "drop") %>%
mutate(Category = Status_Alert) %>%
select(Category, Acreage)
}, error = function(e) {
cat("Could not create trigger summary:", e$message, "\n")
data.frame(Category = character(), Acreage = numeric())
})
# Combine into summary
field_analysis_summary <- bind_rows(phase_summary, trigger_summary)
cat(paste("Created summary with", nrow(field_analysis_summary), "category rows\n"))
} else {
# Use existing summary from RDS
field_analysis_summary <- summary_data$field_analysis_summary
}
# Phase names and trigger names to extract from summary
phase_names <- c("Germination", "Tillering", "Grand Growth", "Maturation", "Unknown Phase")
trigger_names <- c("Harvest Ready", "Strong Recovery", "Growth On Track", "Stress Detected",
"Germination Complete", "Germination Started", "No Active Trigger",
"Ready for harvest-check", "Strong decline in crop health", "Harvested/bare")
# Extract phase distribution - match on category names directly
if (!is.null(field_analysis_summary) && nrow(field_analysis_summary) > 0) {
phase_rows <- field_analysis_summary %>%
filter(Category %in% phase_names) %>%
select(Category, Acreage) %>%
mutate(KPI_Group = "PHASE DISTRIBUTION", .before = 1)
# Extract status triggers - match on category names directly
trigger_rows <- field_analysis_summary %>%
filter(Category %in% trigger_names) %>%
select(Category, Acreage) %>%
mutate(KPI_Group = "STATUS TRIGGERS", .before = 1)
# Calculate area change from field_analysis data
total_acreage <- sum(field_analysis_df$Acreage, na.rm = TRUE)
# Parse Weekly_ci_change to determine improvement/decline
parse_ci_change <- function(change_str) {
if (is.na(change_str)) return(NA)
match <- regexpr("^[+-]?[0-9]+\\.?[0-9]*", change_str)
if (match > 0) {
return(as.numeric(substr(change_str, match, attr(match, "match.length"))))
}
return(NA)
}
field_analysis_df$ci_change_numeric <- sapply(field_analysis_df$Weekly_ci_change, parse_ci_change)
improving_acreage <- sum(field_analysis_df$Acreage[field_analysis_df$ci_change_numeric > 0.2], na.rm = TRUE)
declining_acreage <- sum(field_analysis_df$Acreage[field_analysis_df$ci_change_numeric < -0.2], na.rm = TRUE)
stable_acreage <- sum(field_analysis_df$Acreage[field_analysis_df$ci_change_numeric >= -0.2 &
field_analysis_df$ci_change_numeric <= 0.2], na.rm = TRUE)
improving_pct <- ifelse(total_acreage > 0, round(improving_acreage / total_acreage * 100, 1), 0)
declining_pct <- ifelse(total_acreage > 0, round(declining_acreage / total_acreage * 100, 1), 0)
stable_pct <- ifelse(total_acreage > 0, round(stable_acreage / total_acreage * 100, 1), 0)
# Calculate percentages for phases and triggers
phase_pcts <- phase_rows %>%
mutate(Percent = paste0(round(Acreage / total_acreage * 100, 1), "%"))
trigger_pcts <- trigger_rows %>%
mutate(Percent = paste0(round(Acreage / total_acreage * 100, 1), "%"))
area_change_rows <- data.frame(
KPI_Group = "AREA CHANGE",
Category = c("Improving", "Stable", "Declining"),
Acreage = c(round(improving_acreage, 2), round(stable_acreage, 2), round(declining_acreage, 2)),
Percent = c(paste0(improving_pct, "%"), paste0(stable_pct, "%"), paste0(declining_pct, "%")),
stringsAsFactors = FALSE
)
# Total farm row
total_row <- data.frame(
KPI_Group = "TOTAL FARM",
Category = "Total Acreage",
Acreage = round(total_acreage, 2),
Percent = "100%",
stringsAsFactors = FALSE
)
# Combine all rows with percentages for all
combined_df <- bind_rows(
phase_pcts,
trigger_pcts,
area_change_rows,
total_row
)
# Create grouped display where KPI_Group name appears only once per group
combined_df <- combined_df %>%
group_by(KPI_Group) %>%
mutate(
KPI_display = if_else(row_number() == 1, KPI_Group, "")
) %>%
ungroup() %>%
select(KPI_display, Category, Acreage, Percent)
# Render as flextable with merged cells
ft <- flextable(combined_df) %>%
set_header_labels(
KPI_display = "KPI Category",
Category = "Item",
Acreage = "Acreage",
Percent = "Percent"
) %>%
merge_v(j = "KPI_display") %>%
autofit()
# Add horizontal lines after each KPI group (at cumulative row positions)
# Calculate row positions: row 1 is header, then data rows follow
phase_count <- nrow(phase_rows)
trigger_count <- nrow(trigger_rows)
area_count <- nrow(area_change_rows)
# Add lines after phases, triggers, and area change groups (before totals)
if (phase_count > 0) {
ft <- ft %>% hline(i = phase_count, border = officer::fp_border(width = 1))
}
if (trigger_count > 0) {
ft <- ft %>% hline(i = phase_count + trigger_count, border = officer::fp_border(width = 1))
}
if (area_count > 0) {
ft <- ft %>% hline(i = phase_count + trigger_count + area_count, border = officer::fp_border(width = 1))
}
ft
} else {
cat("KPI summary data available but is empty/invalid.\n")
}
} else {
cat("KPI summary data not available.\n")
}
```
## Cloud Coverage Summary
```{r cloud_coverage_summary, echo=FALSE}
# Display per-field cloud coverage summary
if (cloud_coverage_available && !is.null(per_field_cloud_coverage)) {
# Prepare cloud coverage table for display
# Handle both old and new column naming conventions
cloud_display <- per_field_cloud_coverage %>%
mutate(
Field = if_else(exists("field", list(per_field_cloud_coverage)), field_id,
if_else(exists("Field", list(per_field_cloud_coverage)), Field, field_id)),
Clear_Percent = pct_clear,
Cloud_Acreage = if_else(exists("Cloud_Acreage", list(per_field_cloud_coverage)), Cloud_Acreage,
as.numeric(NA)),
Total_Acreage = if_else(exists("Total_Acreage", list(per_field_cloud_coverage)), Total_Acreage,
as.numeric(NA))
) %>%
select(Field, Cloud_category, Clear_Percent, missing_pixels, clear_pixels, total_pixels) %>%
rename(
"Field" = Field,
"Cloud Status" = Cloud_category,
"Clear %" = Clear_Percent,
"Cloud Pixels" = missing_pixels,
"Clear Pixels" = clear_pixels,
"Total Pixels" = total_pixels
) %>%
arrange(Field)
# Create flextable
ft <- flextable(cloud_display) %>%
autofit()
ft
} else if (exists("cloud_coverage_available") && !cloud_coverage_available) {
cat("Cloud coverage data not available for this week.\n")
} else {
cat("Cloud coverage data not loaded.\n")
}
```
## Field Alerts
```{r field_alerts_table, echo=FALSE}
# Generate alerts table from field analysis status triggers
if (exists("summary_data") && !is.null(summary_data) && "field_analysis" %in% names(summary_data)) {
field_analysis_table <- summary_data$field_analysis
# Extract fields with status alerts (non-null) - use Status_Alert column (not Status_trigger)
alerts_data <- field_analysis_table %>%
filter(!is.na(Status_Alert), Status_Alert != "") %>%
select(Field_id, Status_Alert) %>%
rename(Field = Field_id, Alert = Status_Alert)
if (nrow(alerts_data) > 0) {
# Format alert messages for display
alerts_data <- alerts_data %>%
mutate(
Alert = case_when(
Alert == "germination_started" ~ "🌱 Germination started - crop emerging",
Alert == "germination_complete" ~ "✓ Germination complete - established",
Alert == "stress_detected_whole_field" ~ "🚨 Stress detected - check irrigation/disease",
Alert == "strong_recovery" ~ "📈 Strong recovery - growth accelerating",
Alert == "growth_on_track" ~ "✓ Growth on track - normal progression",
Alert == "maturation_progressing" ~ "🌾 Maturation progressing - ripening phase",
Alert == "harvest_ready" ~ "✂️ Harvest ready - 45+ weeks old",
TRUE ~ Alert
)
)
ft <- flextable(alerts_data) %>%
autofit()
ft
} else {
cat("No active status triggers this week.\n")
}
} else {
cat("Field analysis data not available for alerts.\n")
}
```
```{r data, message=TRUE, warning=TRUE, include=FALSE}
# All data comes from the field analysis performed in 09_field_analysis_weekly.R
# The report renders KPI tables and field summaries from that data
```
```{r load_field_boundaries, message=FALSE, warning=FALSE, include=FALSE}
# Load field boundaries from parameters (with fallback if geometry is invalid)
field_boundaries_loaded <- FALSE
tryCatch({
# Try to load and validate the field boundaries
if (exists("field_boundaries_sf") && !is.null(field_boundaries_sf)) {
# Try to filter - this will trigger geometry validation
AllPivots0 <- field_boundaries_sf %>%
dplyr::filter(!is.na(field), !is.na(sub_field))
# If successful, also create merged field list
AllPivots_merged <- AllPivots0 %>%
dplyr::filter(!is.na(field), !is.na(sub_field)) %>%
dplyr::group_by(field) %>%
dplyr::summarise(.groups = 'drop')
field_boundaries_loaded <- TRUE
safe_log("✓ Successfully loaded field boundaries")
} else {
safe_log("⚠ field_boundaries_sf not found in environment")
}
}, error = function(e) {
# If geometry is invalid, try to fix or skip
safe_log(paste("⚠ Error loading field boundaries:", e$message), "WARNING")
safe_log("Attempting to fix invalid geometries using st_make_valid()...", "WARNING")
tryCatch({
# Try to repair invalid geometries
field_boundaries_sf_fixed <<- sf::st_make_valid(field_boundaries_sf)
AllPivots0 <<- field_boundaries_sf_fixed %>%
dplyr::filter(!is.na(field), !is.na(sub_field))
AllPivots_merged <<- AllPivots0 %>%
dplyr::filter(!is.na(field), !is.na(sub_field)) %>%
dplyr::group_by(field) %>%
dplyr::summarise(.groups = 'drop')
field_boundaries_loaded <<- TRUE
safe_log("✓ Fixed invalid geometries and loaded field boundaries")
}, error = function(e2) {
safe_log(paste("⚠ Could not repair geometries:", e2$message), "WARNING")
safe_log("Continuing without field boundary data", "WARNING")
})
})
```
\newpage
# Section 2: Methodology and Definitions
## About This Report
This automated report provides weekly analysis of sugarcane crop health using satellite-derived Chlorophyll Index (CI) measurements. The analysis supports:
• Scouting of growth related issues that are in need of attention
• Timely actions can be taken such that negative impact is reduced
• Monitoring of the crop growth rates on the farms, providing evidence of performance
• Planning of harvest moment and mill logistics is supported such that optimal tonnage and sucrose levels can be harvested.
The base of the report is the Chlorophyll Index. The chlorophyll index identifies:
• Field-level crop health variations => target problem areas
• Weekly changes in crop vigor => scout for diseases and stress
• Areas requiring attention by the agricultural field teams
Key Features: - High-resolution satellite imagery analysis - Week-over-week change detection - Individual field performance metrics - Actionable insights for crop management
### Explanation of the Report
This report provides a detailed analysis (3x3m of resolution) of sugarcane fields based on satellite imagery. It supports you monitor crop health and development throughout the growing season. The data is processed weekly to give timely insights for optimal decisions.
### What is the Chlorophyll Index (CI)?
The Chlorophyll Index (CI) is a vegetation index that measures the relative amount of chlorophyll in plant leaves. Chlorophyll is the green pigment responsible for photosynthesis in plants. Higher CI values indicate:
• Greater photosynthetic activity
• Healthier plant tissue
• Better nitrogen uptake
• More vigorous crop growth
CI values typically range from 0 (bare soil or severely stressed vegetation) to 7+ (very healthy, dense vegetation). For sugarcane, values between 3-7 generally indicate good crop health, depending on the growth stage.
### What's Reported
1. **Key Performance Indicators (KPIs):**
The report provides a farm-wide analysis based on the Chlorophyll Index (CI) changes. KPIs are calculated field by field and summarized in tables.
- **Area Change:** Summarizes the proportion of field area that is improving, stable, or declining week-over-week, based on CI changes. Helps identify fields requiring immediate attention.
- **Improving areas:** Mean CI change > +0.5 CI units (positive growth trend)
- **Stable areas:** Mean CI change between -0.5 and +0.5 CI units (minimal change)
- **Declining areas:** Mean CI change < -0.5 CI units (negative growth trend)
- **Germination Acreage (CI-based):** Tracks the crop development phase based on CI values:
- **In Germination:** When 10% of field's CI > 2 AND less than 70% reaches CI ≥ 2
- **Post-Germination:** When 70% or more of field's CI ≥ 2 (crop has emerged and established)
- Reports total acres and number of fields in each phase
- **Harvested Acreage:** ⚠️ **DUMMY DATA** - Currently returns zero values as harvesting detection method is under development
- Future implementation will detect harvested fields based on CI drops, backscatter changes, and temporal patterns
- **Mature Acreage:** ⚠️ **DUMMY DATA** - Currently returns zero values as maturity definition is under development
- Future implementation will identify mature fields based on stable high CI over multiple weeks (relative to field's maximum)
- Stability assessment accounts for field-specific CI ranges rather than absolute thresholds
2. **Farm Overview Table:**
Presents numerical field-level results for all KPIs.
---
## Weekly Field Analysis CSV Export
In addition to this Word report, a detailed **field-level CSV export** is generated each week for direct integration with farm management systems and further analysis.
### CSV Structure and Columns
The CSV contains per-field analysis followed by summary statistics:
**Per-Field Rows** (one row per field):
| Column | Description | Example |
|--------|-------------|---------|
| **Field_id** | Unique field identifier | "00110" |
| **Farm_Section** | Sub-area or section name | "a" |
| **Field_name** | Field name for reference | "Tinga1" |
| **Acreage** | Field size in acres | 40.5 |
| **Weekly_ci_change** | CI change from previous week with range; format: `±change (min-max)` | "+2.1 ± 0.15" |
| **Age_week** | Field age in weeks since planting | 40 |
| **Phase (age based)** | Age-based growth phase | "Maturation" |
| **nmr_weeks_in_this_phase** | Number of consecutive weeks in current phase | 2 |
| **Status_trigger** | Current field status (one per field) | "maturation_progressing" |
| **CI_range** | Min-max CI values across field pixels | "3.1-5.2" |
| **CV** | Coefficient of Variation (field uniformity) | 0.158 |
**Summary Statistic Rows** (at end of CSV):
| Field_id | Description | Acreage | Notes |
|----------|-------------|---------|-------|
| `Total_acreage_weekly_change(+)` | Fields improving week-over-week (CI increase > 0.2) | numeric | Sum of improving field acres |
| `Total_acreage_weekly_change(-)` | Fields declining week-over-week (CI decrease < -0.2) | numeric | Sum of declining field acres |
| `Total_acreage_weekly_stable` | Fields with stable CI (±0.2) | numeric | Sum of stable field acres |
| `Total_acreage_weekly_germinated` | Total acreage in Germination phase | numeric | Age 0-6 weeks |
| `Total_acreage_weekly_harvested` | Total acreage ready for harvest | numeric | Age 45+ weeks or `harvest_ready` trigger |
| `Total_acreage_weekly_mature` | Total acreage in Maturation phase | numeric | Age 39+ weeks |
### Key Concepts
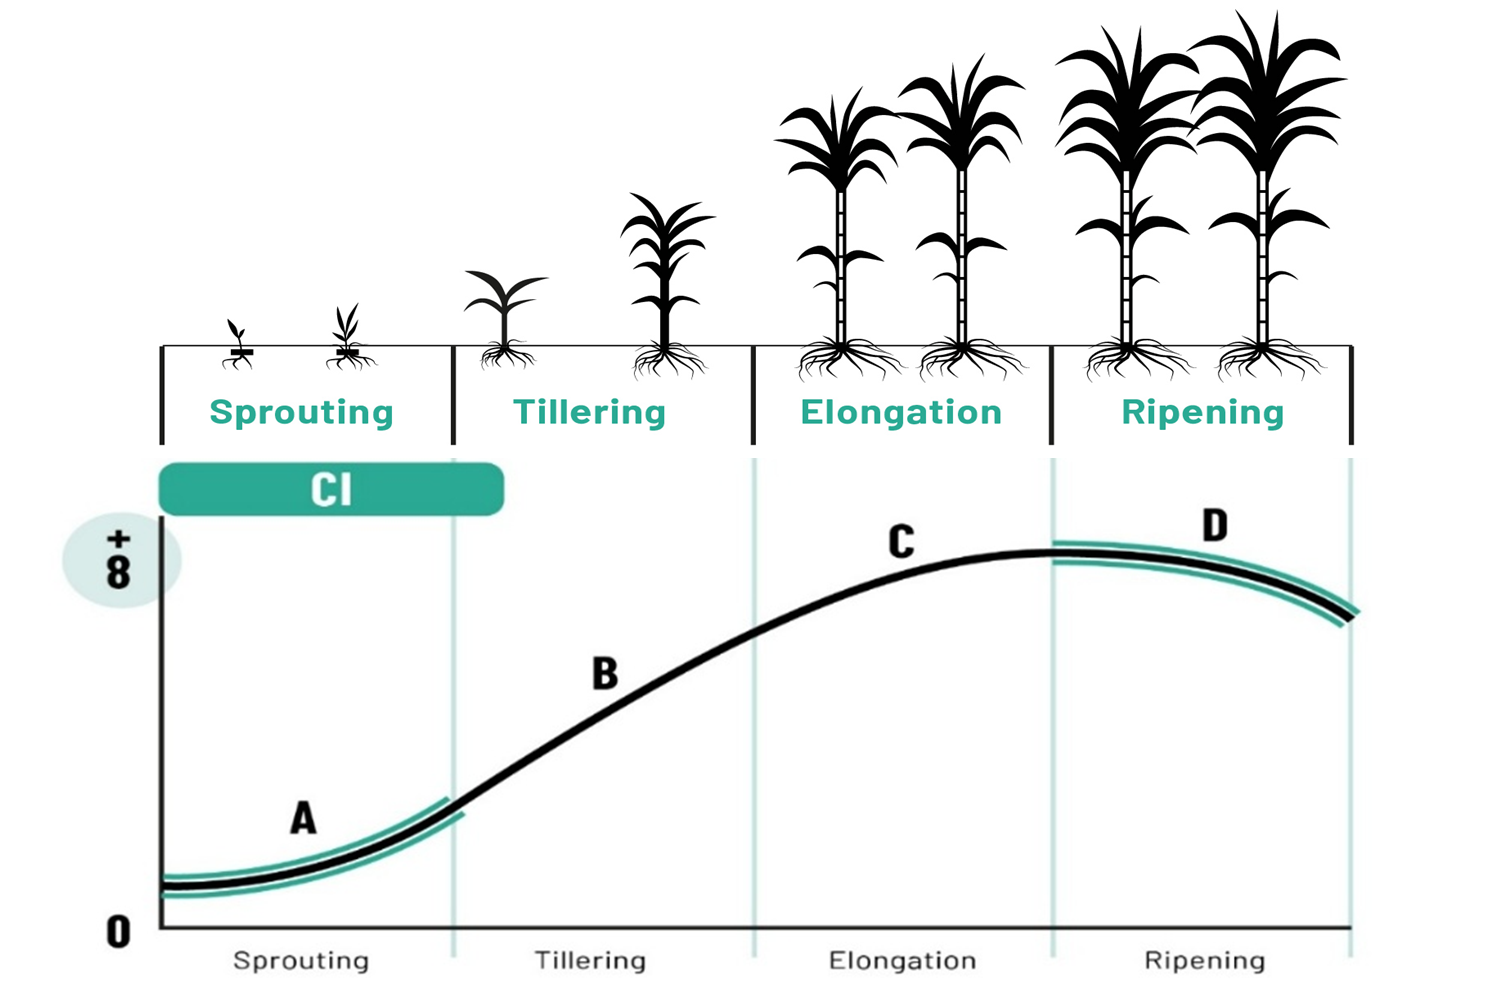
#### 1. **Growth Phases (Age-Based)**
Each field is assigned to one of four growth phases based on age in weeks since planting:
| Phase | Age Range | Characteristics |
|-------|-----------|-----------------|
| **Germination** | 0-6 weeks | Crop emergence and early establishment; high variability expected |
| **Tillering** | 4-16 weeks | Shoot multiplication and plant establishment; rapid growth phase |
| **Grand Growth** | 17-39 weeks | Peak vegetative growth; maximum height and biomass accumulation |
| **Maturation** | 39+ weeks | Ripening phase; sugar accumulation and preparation for harvest |
*Note: Phase overlaps at boundaries (e.g., weeks 4 and 39) are assigned to the earlier phase.*
#### 2. **Status Triggers (Non-Exclusive)**
Status triggers indicate the current field condition based on CI and age-related patterns. Each field receives **one trigger** reflecting its most relevant status:
| Trigger | Condition | Phase | Messaging |
|---------|-----------|-------|-----------|
| `germination_started` | 10% of field CI > 2 | Germination (0-6) | Crop emerging |
| `germination_complete` | 70% of field CI ≥ 2 | Germination (0-6) | Germination finished |
| `stress_detected_whole_field` | CI decline > -1.5 + low CV | Any | Check irrigation/disease/weeding |
| `strong_recovery` | CI increase > +1.5 | Any | Growth accelerating |
| `growth_on_track` | CI consistently increasing | Tillering/Grand Growth (4-39) | Normal progression |
| `maturation_progressing` | High CI, stable/declining | Maturation (39-45) | Ripening phase |
| `harvest_ready` | Age ≥ 45 weeks | Maturation (45+) | Ready to harvest |
#### 3. **Phase Transition Tracking**
The `nmr_weeks_in_this_phase` column tracks how long a field has been in its current phase:
- **Initialization:** First time seeing a field = 1 week
- **Same phase:** Increments by 1 each week
- **Phase change:** Resets to 1 when age-based phase changes
This is achieved by comparing current week's phase assignment to the previous week's CSV. The script loads `[project]_field_analysis_week[XX-1].csv` to detect transitions.
**Example:**
```
Week 29: Field Tinga1 enters Maturation phase (age 39) → nmr_weeks_in_this_phase = 1
Week 30: Field Tinga1 still in Maturation (age 40) → nmr_weeks_in_this_phase = 2
Week 31: Field Tinga1 still in Maturation (age 41) → nmr_weeks_in_this_phase = 3
```
---
\newpage
## Report Metadata
```{r report_metadata, echo=FALSE}
metadata_info <- data.frame(
Metric = c("Report Generated", "Data Source", "Analysis Period", "Total Fields", "Next Update"),
Value = c(
format(Sys.time(), "%Y-%m-%d %H:%M:%S"),
paste("Project", toupper(project_dir)),
paste("Week", current_week, "of", year),
ifelse(exists("AllPivots0"), nrow(AllPivots0 %>% filter(!is.na(field)) %>% group_by(field) %>% summarise()), "Unknown"),
"Next Wednesday"
)
)
ft <- flextable(metadata_info) %>%
set_caption("Report Metadata") %>%
autofit()
ft
```
*This report was automatically generated by the SmartCane monitoring system. For questions or additional analysis, please contact the technical team.*